What is Data Literacy?
Data literacy is a complex array of skills, knowledge, and humanistic reasoning to be applied throughout the data life cycle. This includes a set of dispositions that facilitate the ability to critique data practices, to contextualize data to broader contexts such as platforms, cyberinfrastructure, and society, and to find meaning in data beyond statistical and mathematical arguments. A person who is data literate tries to explain why specific actions are being taken with data, not just what and how.1
These projects help young people and families develop data literacy by engaging in hands-on activities that use visualization, modeling, and real-world data to make information meaningful and relevant.
Webinars
Building Data Literacy through Hands-On Activities (Part 1)
This webinar was presented on May 7, 2026
This session explores how informal STEM education (ISE) researchers and practitioners are bringing data literacy to life through hands-on experiences. Featuring two AISL-funded projects, presenters will share how they engage youth and the public in working with real-world data through co-design and interactive visualizations. They will also discuss their research goals, including what insights have emerged and what they are continuing to investigate about how learners interpret, question, and use data in meaningful ways.
Panelists:
- From the AISL project: Data Literacy with, for, and by Youth: Exploring How Teens Co-Design After-School Programs as Sites of Critical Data Practice
- Dr. Leanne Bowler, Professor, School of Information, Pratt Institute
- Dr. Irene Lopatovska, Professor, School of Information, Pratt Institute
- Dr. Mark Rosin, Associate Professor, School of Liberal Arts & Sciences, Pratt Institute
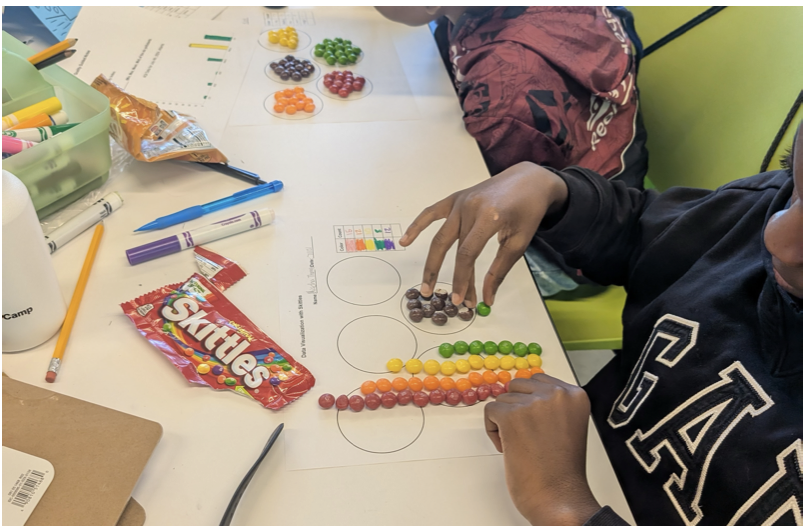
- From the AISL project: Air Pollution Visualizations for Promoting Data Literacy with Middle Schoolers and the Public
- Dr. Jessica Roberts, Associate Professor, School of Interactive Computing, Georgia Tech
Building Data Literacy through Hands-On Activities (Part 2)
This webinar was presented on May 18, 2026
This second session in our Building Data Literacy series explores how informal STEM education (ISE) researchers and practitioners bring data literacy to life through hands-on experiences. Featuring both researcher and practitioner presenters from the AISL-funded project, Mathematizing, Visualizing, and Power (MVP): Appalachian Youth Becoming Data Artists for Community Learning, this session highlights how youth and community members engage with real-world data through community-centered exploration and the creation of data visualizations as artistic expression. These experiences position youth as knowledge producers and contributors to community understanding. Presenters will also share insights from their research, including what they are learning and what they continue to investigate about how learners interpret, question, and use data in meaningful ways.
Join us to hear fresh ideas, insights, and lessons from the field.
Panelists:
- Lynn Hodge, Professor, Director Director of the Center for Enhancing Education in Mathematics and Sciences, University of Tennessee Knoxville
- Dr. Yilang Zhao, Assistant Professor of Educational Data Science, University at Buffalo SUNY
- Ethan Pignataro, Practicing Artist & Art Educator, Knox County
AISL Project Spotlight
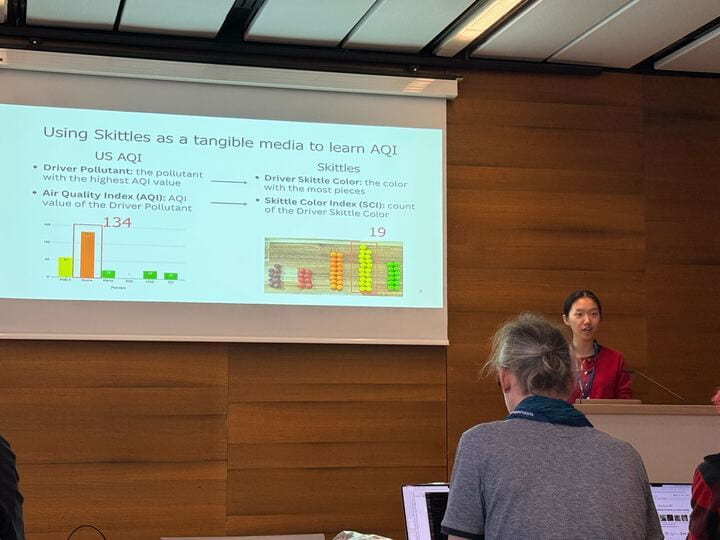
In this AISL Project Spotlight, Jessica Roberts (Principal Investigator) shares about the project: Air Pollution Visualizations for Promoting Data Literacy with Middle Schoolers and the Public (NSF #2314109).
“We believe that data visualization literacy skills can provide sensemaking tools to students for understanding complex environmental data like air pollution, while simultaneously air quality—as a familiar but complex data set—can provide rich content and motivation for improving data literacy skills.”
AISL Project Resources
Resources from the AISL project: Mathematizing, Visualizing, and Power (MVP): Appalachian Youth Becoming Data Artists for Community Learning
- Project Website
- Youth Data Visualization Practices: Rhetoric, Art, and Design
- CONNECTING DATA SCIENCE AND ARTS: EXPLORING DATA-ART INTEGRATION IN A DATA-ART INQUIRY PROGRAM
- The Role of Framing in Educators’ Conversations around Youth’s Engagement in Community-Centered Artistic Data Visualization
- The Role of Entry Points in Defining, Cultivating, and Sustaining Community Learning with Data Artists
- Data Visualization Renarrated: Probing the Role of Renarrating in Data Visualization Reimagining
- Design Considerations for Supporting Youth in Developing Critical Community-Centered Artistic Data Visualizations
- Bridging Data and Art: Investigating Data-Art Connections in a Data-Art Inquiry Program
- Exploring Youth’s Data Reasoning with Data Visualization
Resources from the AISL project: Data Literacy with, for, and by Youth: Exploring How Teens Co-Design After-School Programs as Sites of Critical Data Practice
- Project website: Resources
- Co-Designing Data Labs at the Public Library: Data Literacy with, for, and by Teens
- Methods of Engaging Teens in Conversations about Personal Digital Data: Public Library Context
- Teen-adult interactions during the co-design of data literacy activities for the public library: insights from a natural language processing analysis of linguistic patterns
- Youth Data Literacy: Resources for Programs and Activities
- Data Literacy with, for, and by Youth: Activity Guide
Resources from the AISL project: Air Pollution Visualizations for Promoting Data Literacy with Middle Schoolers and the Public
- Skills and Dispositions for PFL: Promoting Data Literacy for Middle School Students in a Summer Camp
- DPV (Domain, Purpose, Visual) Framework: A data visualization design pedagogical method for middle schoolers
- Teaching Air Quality and Data Visualization Using Tangible Models for Middle Schoolers
- ContAQT: Designing an Interactive Data Display to Make Multi-Pollutant Air Quality Data Accessible
Additional Resources
- A better fit: using data roles to appeal to more learners and promote critical data literacy (Note: this is an EBSCO article — REVISE Center offers free EBSCO access! Learn more here.)
- Public Library Association: Data Literacy for Youth
- Tableau Data For Kids (free resources)
- Data Dashboards (and other resources)
- Youth Data Stories (instructor guides and teaching resources)
- Data Visualization Resources: DPV (Domain, Purpose, Visual) Framework: A data visualization design pedagogical method for middle schoolers
References
1Data Literacy with, for, and by Youth Activity Guide: Step-by-step instructions for six data literacy activities created and tested alongside teen co-designers during 24 Data Labs held at the Brooklyn Public Library.
2Y. Li, A. Endert and J. Roberts, “Teaching Air Quality and Data Visualization Using Tangible Models for Middle Schoolers,” 2025 IEEE VIS Workshop on Visualization Education, Literacy, and Activities (EduVIS), Vienna, Austria, 2025, pp. 27-32, doi: 10.1109/EduVIS69391.2025.00008.