Dimensions of Success (DoS) Observation Tool
The Dimensions of Success observation tool, or DoS, pinpoints twelve indicators of Science Technology Enginerring and Math (STEM) program quality in out-of-school time. It was developed and studied with funding from the National Science Foundation (NSF Award #1008591) by the Program in Education, Afterschool and Resiliency (PEAR), along with partners at Educational Testing Service (ETS) and Project Liftoff. In 2014, a technical report was released, describing the tool and its psychometric properties. The DoS observation tool focuses on understanding the quality of a STEM activity in an out-of-school time learning environment and includes an explanation of each dimension and its key indicators, as well as a 4-level rubric with descriptions of increasing quality. Today, over 700 people have been trained to use the DoS tool, and over 12 state networks have adopted DoS to measure the quality of their afterschool STEM programming.
A closer look at the tool
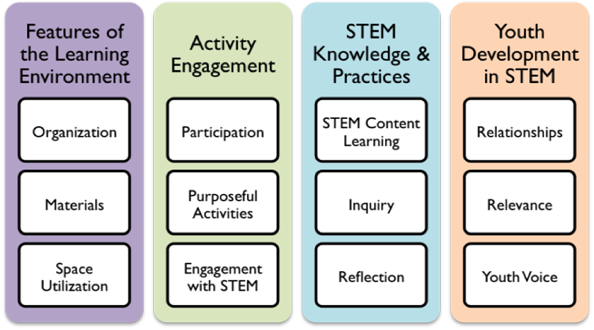
DoS measures twelve dimensions that fall in 4 broad domains: Features of the Learning Environment, Activity Engagement, STEM Knowledge and Practices, and Youth Development in STEM. The first three dimensions look at the logistics and preparation of the activity, whether or not the materials are appealing and appropriate for the learning goals, and how the learning environment creates a suitable space where students can explore science informally. The second three dimensions look at how the activity engages students: for example, the dimensions examine whether or not all students are getting access to the activity, whether activities are moving towards STEM concepts and practices purposefully or superficially, and whether or not the activities are hands-on, and designed to support students to think for themselves versus being given the answer. The next domain looks at how the informal STEM activities are helping students understand STEM concepts, make connections, participate in the inquiry practices that STEM professionals use (e.g., collecting data, using scientific models, building explanations, etc.), and whether students have time to make meaning and reflect on their experiences. Finally, the last domain assesses the student-facilitator and student-student interactions and how they encourage or discourage participation in STEM activities, whether or not the activities make STEM relevant and meaningful to students’ everyday lives, and how the interactions allow youth to make decisions and have a voice in the learning environment and community.

A System of Quality
The DoS observation tool allows observers to understand where an activity is strong or weak and draw evidence from practice to make decisions about appropriate professional development or coaching. Practitioners and out-of-school time site leaders use the tool internally to reflect on their programming, while evaluators can also use the tool to help programs report trends to funders, parents, and other stakeholders. DoS users in the field report that collecting live data about their activities was useful, but that they also needed support in figuring out how to plan for higher quality based on those observations. Therefore, the DoS Program Planning Tool (DoS-PPT) was developed as a complementary resource for helping program staff and leaders plan for high-quality STEM experiences. The DoS-PPT requires no formal training to use, and is available freely on the PEAR website: http://pearweb.org/tools/dostool.html
What we learned so far about measuring quality in out-of-school time STEM
What we wanted to find out:
- The goal of our study was to see how trained observers used DoS in a range of afterschool settings, including STEM summer camps, programs run at schools, programs run at community centers, programs run at museums/science centers, business-sponsored programs, etc.
- Specifically, the study looked at the validity of the tool and whether it was able to capture the nuances between activities and find stable ratings across observers (raters observed in pairs).
Interesting Developments:
- In a sub-study looking at the rater reliability of external observers versus internal observers in the Summer of 2014 no significant difference was found in the ratings by internal site staff and those at the program level who were not directly involved in the day-to-day running of a site. This was encouraging, as it supported the idea that internal observers did not hold a strong bias towards leaning DoS scores higher. The evidence supported the idea that , if a budget was not available for external evaluators, the DoS tool could be used by internal staff at the afterschool site.
Next Steps
DoS is being used in over 12 states with over 700 observers trained. Interest in DoS is growing, and we are continually getting new requests from the field about what other supporting tools are needed to complement DoS. California provided the push to develop the DoS-PPT and now many states including Pennsylvania and Iowa are pushing for a feedback tool, which will allow program leaders to translate the DoS scores into a discussion/coaching module for staff. To see an example of how the Iowa Children’s Museum is using the DoS planning tool, watch this video: https://youtu.be/Gy7Vl5ZrvKw